
Quick Summary
Key Takeaway: A square root curve (often called a Texas curve) is a non-linear grading method that adjusts test scores using the simple mathematical formula: Curved Score = 10 × √(Raw Score). It provides a large point boost to lower scores while giving smaller increases to high scores. For example, a raw score of 49% becomes a 70%, while an 81% becomes a 90%.
Grade Impact Quick Answer: If you currently have a 94% average and get a 60% on a new assignment, your new final grade depends on how many past assignments you have in the gradebook. In a class with 4 past tests, a 60% drops your overall average to 87.2%. However, if that 60% is curved using a square root curve, it turns into a 77.5%, keeping your overall course average at 90.7% (A- range).
What Is a Square Root Curve?
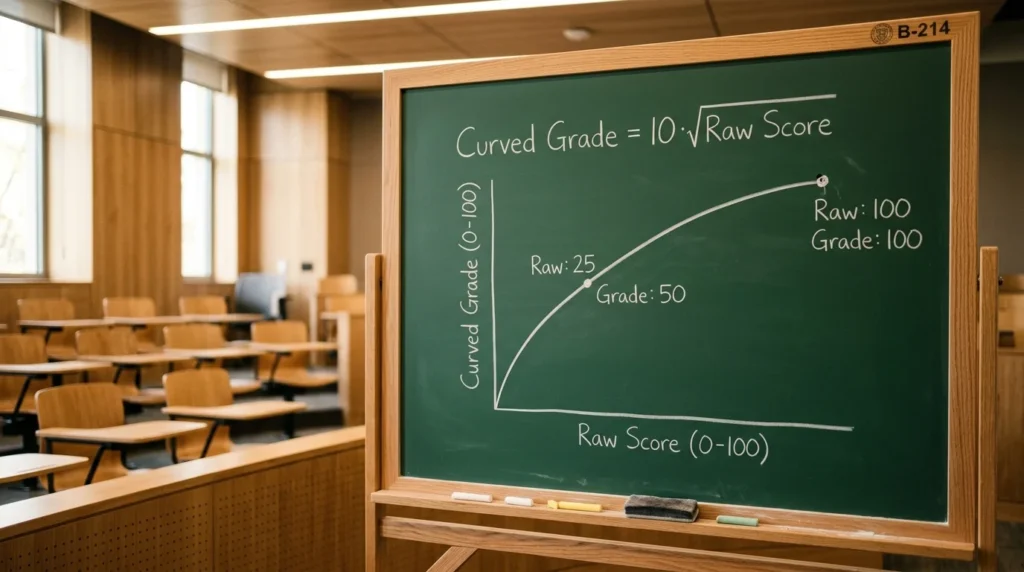
A square root curve is a practical grading technique used by teachers, professors, and academic institutions to adjust test scores after an unusually difficult exam.
Instead of adding a fixed number of points to everyone’s paper, it uses the mathematical square root function. This function creates a curved scale that gives more help to students who need it most.
In many high schools and universities across North America, educators refer to this specific method as the Texas Curve. It is especially popular in science, technology, engineering, and mathematics (STEM) courses where exam averages can drop unexpectedly low.
The main advantage of a square root curve is fairness. It lifts low grades out of the failing zone without artificially pushing top-performing students past 100%.
If you want to curve test scores for your class or check your own grade quickly, you can use our free online Grade Curve Calculator.
How the Square Root Curve Formula Works
The math behind the square root curve is straightforward and easy to compute. You do not need advanced statistics software or complex equations to calculate it.
The Core Formula:
Curved Score = 10 × √(Raw Score)
Where Raw Score is the student’s original score expressed as a percentage between 0% and 100%.
Step-by-Step Calculation Guide
To calculate your curved grade manually using a standard square root calculator or scientific calculator, follow these 3 simple steps:
- Find your raw percentage score on the test. For example, let’s say you scored a 64%.
- Take the principal square root of that raw number. The square root of 64 is 8 (since 8 × 8 = 64).
- Multiply the result by 10. Multiplying 8 by 10 gives you 80%.
In this example, your test grade moves from a 64% (which is a D grade on most standard grading scales) up to an 80% (a solid B- grade). That is a total gain of 16 percentage points.
Why Teachers Use the Square Root Curve
Teachers choose the square root curve calculator method over simple point additions or standard bell curves for several important reasons:
1. Helps Struggling Students Most
A student with a raw score of 25% gets boosted to a 50% (+25 points). A student with a 49% gets boosted to a 70% (+21 points). This gives hardworking students a realistic chance to recover from one bad exam.
2. Protects High Scores From Exceeding 100%
On a flat curve where a teacher simply adds 15 points to every paper, a student who earned a 92% would end up with 107%. A square root curve handles high scores gracefully. A score of 81% becomes 90% (+9 points), while a score of 95% becomes 97.5% (+2.5 points). A perfect 100% remains 100%.
3. Preserves Student Class Rank (Monotonicity)
The square root function is strictly increasing. This means if Student A scored higher than Student B before the curve, Student A will always score higher than Student B after the curve. No student ever swaps rank positions.
4. No Point Penalties
Unlike standard bell curve grading scales, no student ever loses points under a square root curve. Every score between 1% and 99% goes up.
If you want to learn more about different class grading rules and policies, explore our helpful Grade Curving FAQs.
Complete Square Root Curve Chart (0 to 100 Raw Scores)
Below is a complete square root curve chart showing raw percentage scores alongside their square roots, final curved scores, total points gained, and letter grade changes. You can use this chart as a quick reference lookup guide.
| Raw Score (%) | Square Root √(Raw) | Curved Score (10 × √Raw) | Total Points Added | Letter Grade Change |
|---|---|---|---|---|
| 25% | 5.000 | 50.00% | +25.00 pts | F → F (Partial Credit) |
| 30% | 5.477 | 54.77% | +24.77 pts | F → F |
| 36% | 6.000 | 60.00% | +24.00 pts | F → D- |
| 40% | 6.325 | 63.25% | +23.25 pts | F → D |
| 45% | 6.708 | 67.08% | +22.08 pts | F → D+ |
| 49% | 7.000 | 70.00% | +21.00 pts | F → C- |
| 55% | 7.416 | 74.16% | +19.16 pts | F → C |
| 60% | 7.746 | 77.46% | +17.46 pts | D → C+ |
| 64% | 8.000 | 80.00% | +16.00 pts | D+ → B- |
| 70% | 8.367 | 83.67% | +13.67 pts | C- → B |
| 75% | 8.660 | 86.60% | +11.60 pts | C → B+ |
| 80% | 8.944 | 89.44% | +9.44 pts | B- → B+ |
| 81% | 9.000 | 90.00% | +9.00 pts | B- → A- |
| 85% | 9.220 | 92.20% | +7.20 pts | B → A- |
| 90% | 9.487 | 94.87% | +4.87 pts | A- → A |
| 95% | 9.747 | 97.47% | +2.47 pts | A → A+ |
| 100% | 10.000 | 100.00% | +0.00 pts | Perfect Score Unchanged |
As you can see from the chart, the largest point increases occur in the lower raw score ranges (25% to 64%), while scores above 80% receive smaller, targeted boosts.
Step-by-Step Worked Calculation Examples
Let’s walk through 3 practical real-world classroom examples to see how the square root curve calculator formula works step by step.
Example 1: The Hard Physics Midterm
Suppose a Physics professor gives a challenging midterm exam. The class raw average is only 52%. Student Mark scores a raw 49%.
- Step 1: Mark finds the square root of 49. (√49 = 7)
- Step 2: Mark multiplies 7 by 10. (7 × 10 = 70%)
- Result: Mark’s score moves from a failing 49% (F) to a passing 70% (C-).
Example 2: The Above-Average Student
In the same Physics class, Student Sarah scores a raw 78%.
- Step 1: Sarah finds the square root of 78. (√78 = 8.832)
- Step 2: Sarah multiplies 8.832 by 10. (8.832 × 10 = 88.32%)
- Result: Sarah’s grade jumps from 78% (C+) to 88.32% (B+).
Example 3: Customized Multiplier Curve
Sometimes a teacher wants a milder curve. Instead of multiplying by 10, they might use a multiplier like 9.5 or 9.8.
- Custom Formula: Curved Score = 9.5 × √(Raw Score)
- If a student scores an 81%, their curved grade is
9.5 × 9 = 85.5%.
Grade Impact Breakdown: How Much Will a 60 Affect My Grade If I Have a 94?
Many students ask this exact question during test season: how much will a 60 affect my grade if i have a 94?
The exact answer depends on 3 key factors:
- How many past assignments you already have in the gradebook.
- The weight of the new assignment in your syllabus.
- Whether the score of 60% is raw or curved.
Let’s look at each scenario in detail.
Scenario 1: Equal Weight Assignments (Simple Average)
If all tests in your class carry the exact same weight, you can calculate your new overall average using this simple formula:
New Overall Grade = [(Current Average × Past Assignments Count) + New Score] ÷ (Total Assignments Count)
Here is what happens when a new score of 60% is added to an existing 94% average across different class sizes:
| Past Assignments (at 94%) | New Score Added | Calculation Formula | New Overall Grade | Total Point Drop | Letter Grade Impact |
|---|---|---|---|---|---|
| 1 Past Test | 60% | (94 + 60) ÷ 2 | 77.00% | -17.00 pts | A → C+ (Severe Drop) |
| 2 Past Tests | 60% | [(94 × 2) + 60] ÷ 3 | 82.67% | -11.33 pts | A → B- |
| 3 Past Tests | 60% | [(94 × 3) + 60] ÷ 4 | 85.50% | -8.50 pts | A → B |
| 4 Past Tests | 60% | [(94 × 4) + 60] ÷ 5 | 87.20% | -6.80 pts | A → B+ |
| 9 Past Tests | 60% | [(94 × 9) + 60] ÷ 10 | 90.60% | -3.40 pts | A → A- (Stays in A Range) |
| 19 Past Tests | 60% | [(94 × 19) + 60] ÷ 20 | 92.30% | -1.70 pts | A → A (Minimal Impact) |
Important Lessons:
- Early in the term (1 to 3 past tests), a single 60% pulls a 94% down hard—by 8 to 17 percentage points.
- Late in the term (10+ past tests), your previous high scores cushion the blow. The single 60% only drops your grade by 1 to 3 points.
Scenario 2: Weighted Grading Categories
Most high school and college courses use weighted categories (such as Homework = 20%, Quizzes = 30%, Exams = 50%).
Here is how a score of 60% affects a 94% average under different category weights:
- 60% on a Small Quiz (5% of total grade):
- Calculation:
(94 × 0.95) + (60 × 0.05) = 89.3 + 3.0 = 92.3% - Grade drop: 1.7 points (Your overall grade stays at 92.3%).
- Calculation:
- 60% on a Midterm Exam (20% of total grade):
- Calculation:
(94 × 0.80) + (60 × 0.20) = 75.2 + 12.0 = 87.2% - Grade drop: 6.8 points (Your grade drops to an 87.2% B+).
- Calculation:
- 60% on a Major Final Exam (40% of total grade):
- Calculation:
(94 × 0.60) + (60 × 0.40) = 56.4 + 24.0 = 80.4% - Grade drop: 13.6 points (Your grade drops to an 80.4% B-).
- Calculation:
Scenario 3: What If the 60 Score Is Curved With a Square Root Curve?
This is where the square root curve helps students protect their overall GPA.
If your raw test score was a 60%, a teacher applying a square root curve turns your 60% into 77.46% (10 × √60 = 77.46).
Now let’s compare what happens to your 94% average (assuming 4 past tests) with and without the curve:
- Without Curve (Raw 60%):
[(94 × 4) + 60] ÷ 5 = 87.20%(B+ Grade) - With Square Root Curve (Curved 77.46%):
[(94 × 4) + 77.46] ÷ 5 = 90.69%(A- Grade)
Thanks to the square root curve, your final overall grade stays above 90%, preserving your A- average.
Square Root Curve vs. Other Curving Methods
Not all grade curves work the same way. Here is a clear comparison between the square root curve and other popular grading methods:
| Curving Method | Formula / How It Works | Best Used When | Main Limitation |
|---|---|---|---|
| Square Root Curve | 10 × √(Raw Score) | Test scores are low and struggling students need help without over-inflating high scores. | Non-linear scale gives different point increases to different students. |
| Flat Point Addition | Raw Score + Fixed Points | The whole class missed 1 or 2 bad questions. | High scores can easily go over 100%. |
| Linear Scale (Max Score) | (Raw ÷ Highest Class Score) × 100 | The top student scored an 85% instead of 100%. | If one student gets a 100%, nobody else gets curved. |
| Standard Bell Curve | Normal distribution using class mean and standard deviation. | Large standardized courses (200+ students) in law or medical school. | Forces a fixed percentage of failing grades even if everyone did well. |
To read more about our background and grading research team, visit our About Us page.
How to Use Our Online Square Root Curve Calculator
If you are a teacher with dozens of student grades, calculating square root scores manually for every student takes time. Our free online calculator makes it fast and effortless.
Simple Steps for Teachers & Students:
- Open our main Grade Curve Calculator.
- Paste your raw class scores or student grades into the input box.
- Select Square Root Curve from the menu.
- Click Calculate to instantly view curved scores, grade distributions, and summary stats.
You can also copy the resulting grade table directly into Excel, Google Sheets, or your school gradebook.
If you have questions or suggestions for new calculator features, feel free to contact us through our Contact Us page or review our website Disclaimer.
Frequently Asked Questions (FAQs)
No. For any percentage score between 1% and 99%, the square root curve will always increase your score. A raw score of 100% remains 100%. No student ever loses points under a square root curve.
“Texas Curve” is an informal nickname widely used in North American colleges and universities for the 10 × √(Raw Score) formula.
No. Because the square root of 100 is 10, 10 × 10 = 100. The maximum possible curved score is strictly 100%.
Enter your raw percentage score, press the square root key (√), and then multiply by 10. For example: enter 81, press √ (gives 9), multiply by 10 (gives 90%).
First, check your syllabus to see how remaining assignments are weighted. Next, speak with your teacher to ask if they offer extra credit, drop the lowest quiz score, or plan to curve major exams using a square root curve.