
Google Classroom is used by millions of K-12 and college educators to assign coursework, track student progress, and organize gradebooks. However, unlike traditional grading software, Google Classroom does not include a built-in curve button or automated grade distribution tool. If an exam turns out to be more difficult than intended, teachers must adjust student scores manually or use external tools.
This guide walks through how Google Classroom handles grade records, how to export grades directly to Google Sheets, and how to apply curved grade formulas accurately using simple online tools.
Does Google Classroom Have a Built-In Grade Curve Feature?
Google Classroom does not offer a native automated curving tool inside its grading interface. When you enter a grade in Google Classroom, it records the exact number of points you type.
To curve assignment scores for a Google Classroom roster, instructors typically use one of two approaches:
- Direct Google Sheets Formulas: Writing mathematical functions inside a Google Sheet after exporting grades.
- Online Calculator Copy-Paste Method: Copying raw assignment scores into a specialized tool like our Grade Curve Calculator, generating the curved scores, and pasting them back into your Google Sheet.
The copy-paste approach is often preferred because it avoids complex spreadsheet formula syntax and allows you to test multiple curving algorithms before selecting a final grade distribution.
Step-by-Step Guide: How to Curve Google Classroom Grades
Follow these steps to export grades from Google Classroom, calculate curved scores, and update your gradebook.
Step 1: Export Grades from Google Classroom
- Log in to Google Classroom and select your class.
- Click the Classwork tab at the top of the page.
- Click on the assignment you wish to curve, then click View assignment.
- In the top-right corner of the Student Work page, click the Settings gear icon (⚙️).
- Choose one of the export options:
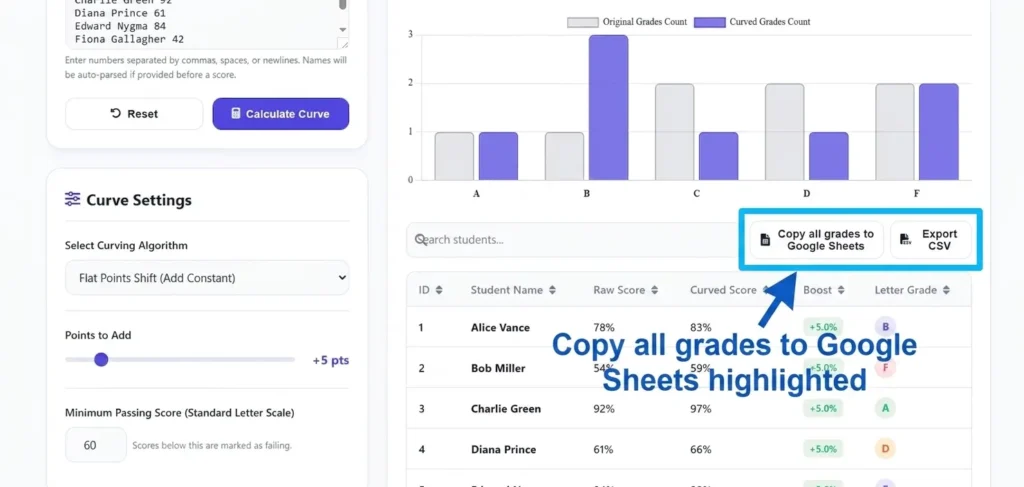
- Copy all grades to Google Sheets: Creates a new Google Sheet containing your full class roster and all assignment columns.
- Download all grades as CSV: Downloads a CSV spreadsheet file to your computer.
- Download these grades as CSV: Downloads scores for the specific assignment only.
For most teachers, selecting Copy all grades to Google Sheets is the fastest option.
Step 2: Copy Raw Assignment Scores
- Open the exported Google Sheet.
- Locate the column corresponding to the assignment you are curving (for example, Unit 3 Test).
- Highlight and copy the column of raw student percentage scores or point values.
Note: If you are also interested in Excel workflows, you can check our companion guide on how to curve grades in Excel.
Step 3: Calculate Curved Scores
- Open the online Grade Curve Calculator.
- Paste the copied column of raw student scores directly into the input text box (or use the manual editor to adjust individual scores if needed).
- Select the curving algorithm that matches your grading goals:
- Square Root Curve (Texas Curve): Uses the formula
10 × √Raw Score. This provides a significant boost to lower scores while tapering off for higher scores. You can read more about how this works in our guide on the Texas root curve explained. - Flat Point Shift: Adds a fixed number of points (such as +5 or +8 points) to every student score.
- Linear Scale (Max Score Scaling): Scales scores based on the highest score achieved in the class using
(Raw Score ÷ Highest Score) × 100. - Standard Deviation Bell Curve: Calculates grades using class mean (μ) and standard deviation (σ) to create a standardized normal distribution. Learn more in our overview of bell curve grading explained.
- Square Root Curve (Texas Curve): Uses the formula
- Click Calculate. The calculator will generate summary statistics (mean, median, standard deviation) alongside a table of curved student scores.
Step 4: Paste Curved Scores Back into Google Sheets
- Below the calculator results, click Copy Table to Clipboard (or click Export CSV).
- Return to your open Google Sheet.
- Insert a new column next to the original assignment column and label it clearly, such as Unit 3 Test (Curved).
- Paste the curved values into the new column, confirming that each score aligns with the correct student name.
Step 5: Update Grades in Google Classroom
- Return to your Google Classroom assignment page.
- Enter the new curved score into the grade input box next to each student’s name.
- Click Return if you want students to view their updated curved grade and feedback.
Comparing Popular Curving Formulas in Google Sheets
When adjusting assignment scores, selecting the right mathematical formula depends on the raw score distribution and your course objectives.
| Curving Method | Mathematical Formula | Recommended Use Case | Impact on Student Scores |
|---|---|---|---|
| Square Root Curve | 10 × √Raw Score | Difficult exams where low scores need help without pushing top scores over 100%. | Large gain for low scores (+21 pts on a 49), small gain for high scores (+2.5 pts on a 95). |
| Flat Point Shift | Raw Score + Constant | Minor test corrections or when 1-2 questions had errors. | Equal point gain for all students. May require capping scores at 100%. |
| Linear Max Score Scale | (Raw ÷ Max Score) × 100 | Tests where the top student scored less than 100% (e.g., top score was 84%). | Scales scores proportionally so the top score becomes 100%. |
| Standard Deviation Bell Curve | Based on Mean (μ) and Std Dev (σ) | Large courses (100+ students) requiring standardized relative grading. | Assigns grades based on relative distance from the class average. |
If you want to compare how linear scales differ from bell curves, read our detailed comparison of bell curve vs linear curve.
Best Practices for Curving Grades in Google Classroom
- Maintain a Raw Score Record: Always preserve your original raw grades in your primary Google Sheet. Creating a separate column for curved grades maintains transparency and ensures you can review raw student performance later.
- Explain the Curve Method to Students: If you apply a curve, publish a short stream post or assignment private comment explaining how the curve was calculated. Clear communication reduces student anxiety and grade disputes.
- Verify Institutional Policy: Before applying a curve, check department guidelines. Some schools have specific policies on whether grades can be curved upward or downward. For an in-depth look at fairness, review our article on is grading on a curve fair.
Frequently Asked Questions
Yes. For example, to apply a square root curve in Google Sheets, enter the formula =10*SQRT(B2) in an empty cell (where B2 is the cell containing the raw percentage score) and drag the formula down the column.
Google Classroom only sends a grade notification when you click the Return button. Editing a score in the grade draft box will not notify the student until you explicitly return the assignment.
No. For any percentage score between 1% and 99%, a square root curve will always increase the student’s score. A score of 100% stays 100%. No student loses points under a square root curve.