
Google Sheets has become one of the most popular tools for teachers, professors, and school administrators. Since it’s free, cloud-based, and easy to share, many educators use it to organize student records and calculate final grades.
If an exam turns out to be more difficult than expected, you may need to adjust student scores fairly. Fortunately, Google Sheets makes it easy to apply different grading methods using simple formulas.
In this guide, you’ll learn how to curve grades in Google Sheets using several common methods, including Linear Curves, Percentage Curves, Bell Curves, and the Texas Root Curve.
If you prefer not to create formulas manually, you can also use our Grade Curve Calculator to compare multiple grading methods instantly.
Quick Answer
To curve grades in Google Sheets, enter student scores into one column and apply a grading formula in another column. For example:
- Linear Curve:
=B2+5- Percentage Curve:
=B2*1.10- Texas Root Curve:
=SQRT(B2)*10Google Sheets automatically updates the results whenever you change the original scores.
What Does It Mean to Curve Grades?
Grade curving is the process of adjusting students’ original exam scores using a mathematical method. Instead of relying only on raw scores, instructors apply a curve to improve fairness or account for unusually difficult exams.
There are several different grading methods, and each one produces different results depending on the situation.
If you’re new to grade curving, read our guide on What Is a Grade Curve? to understand the basics before choosing a grading method.
Why Use Google Sheets Instead of Excel?
Both Google Sheets and Microsoft Excel are excellent spreadsheet tools. However, Google Sheets offers several advantages for teachers who collaborate with colleagues or work across multiple devices.
| Google Sheets | Microsoft Excel |
|---|---|
| Free to use | Usually requires a license |
| Cloud-based | Primarily desktop software |
| Real-time collaboration | Limited collaboration |
| Automatic saving | Manual saving (unless using OneDrive) |
| Accessible anywhere | Installed on one device |
If you already use Excel, check out our guide on How to Curve Grades in Excel.
Step 1: Prepare Your Grade Sheet
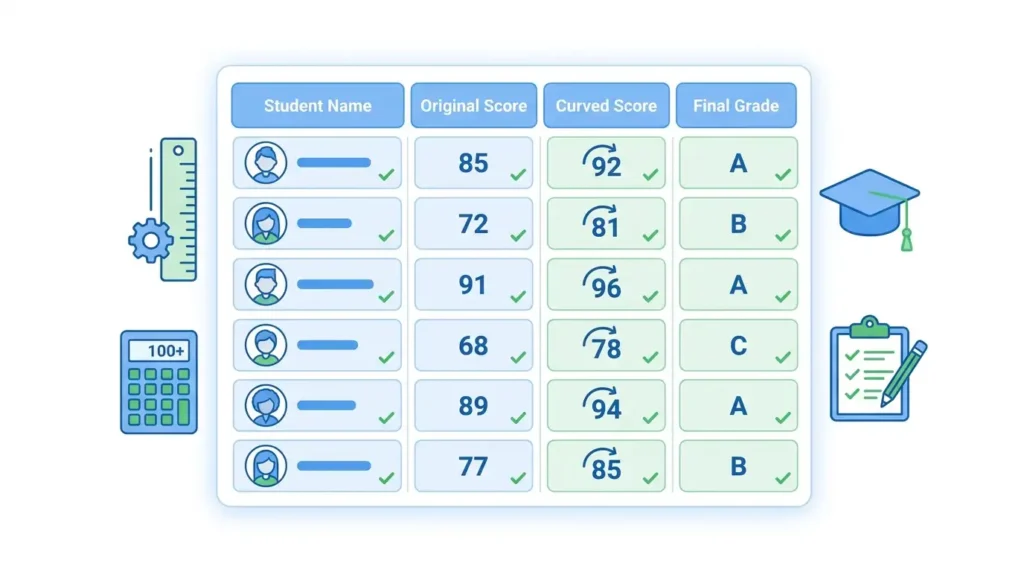
Start by creating a simple spreadsheet.
| Student | Original Score |
|---|---|
| Emma | 58 |
| Noah | 65 |
| Sophia | 74 |
| Liam | 81 |
| Olivia | 92 |
Keep your original scores in one column and place adjusted grades in another column.
Method 1: Apply a Linear Curve
A Linear Curve is the easiest grading method.
Simply add the same number of points to every student’s score.
If the original score is in cell B2, use:
=B2+5Copy the formula down for every student.
Example
| Original | Curved |
|---|---|
| 58 | 63 |
| 65 | 70 |
| 74 | 79 |
| 81 | 86 |
| 92 | 97 |
This method keeps the class ranking exactly the same because every student receives the same increase.
Method 2: Apply a Percentage Curve
Instead of adding points, you can increase every score by a percentage.
For a 10% increase, enter:
=B2*1.10Example
| Original | Curved |
|---|---|
| 60 | 66 |
| 75 | 82.5 |
| 90 | 99 |
Percentage curves provide larger increases to students with higher original scores.
Method 3: Use the Texas Root Curve
The Texas Root Curve gives greater improvements to lower scores while making smaller adjustments to higher scores.
Use this formula:
=SQRT(B2)*10Example
| Original | Approximate Curved |
|---|---|
| 25 | 50 |
| 49 | 70 |
| 64 | 80 |
| 81 | 90 |
| 100 | 100 |
This method is popular because it rewards struggling students without dramatically changing the grades of high-performing students.
Learn more in our complete guide to the Texas Root Curve.
Method 4: Create a Bell Curve
A Bell Curve is based on the distribution of scores across the class.
Google Sheets provides built-in statistical functions that make Bell Curve calculations possible.
Useful formulas include:
=AVERAGE(B2:B31)=STDEV.P(B2:B31)Bell Curves are more statistical than Linear Curves and may produce different results depending on overall class performance.
To understand the differences, read Bell Curve vs Linear Curve.
Useful Google Sheets Functions
| Function | Purpose |
|---|---|
| AVERAGE() | Calculates class average |
| MAX() | Finds the highest score |
| MIN() | Finds the lowest score |
| SQRT() | Texas Root Curve |
| STDEV.P() | Standard deviation |
| ROUND() | Rounds final grades |
These formulas cover most grading scenarios.
Worked Example
Suppose your class receives the following scores.
| Student | Original |
|---|---|
| Emma | 58 |
| Noah | 65 |
| Sophia | 74 |
| Liam | 81 |
| Olivia | 92 |
Linear Curve (+5)
| Student | New Score |
|---|---|
| Emma | 63 |
| Noah | 70 |
| Sophia | 79 |
| Liam | 86 |
| Olivia | 97 |
Percentage Curve (+10%)
| Student | New Score |
|---|---|
| Emma | 63.8 |
| Noah | 71.5 |
| Sophia | 81.4 |
| Liam | 89.1 |
| Olivia | 101.2 |
Depending on your grading policy, you may cap scores at 100.
Common Mistakes to Avoid
Even experienced teachers occasionally make spreadsheet mistakes.
Avoid these common errors:
- Editing original scores instead of creating a new column.
- Applying the curve more than once.
- Using incorrect cell references.
- Forgetting to round grades when required.
- Ignoring your school’s grading policy.
If you’re unsure whether grade curves are permitted at your institution, read Do Colleges Grade on a Curve?.
Google Sheets vs Online Grade Curve Calculator
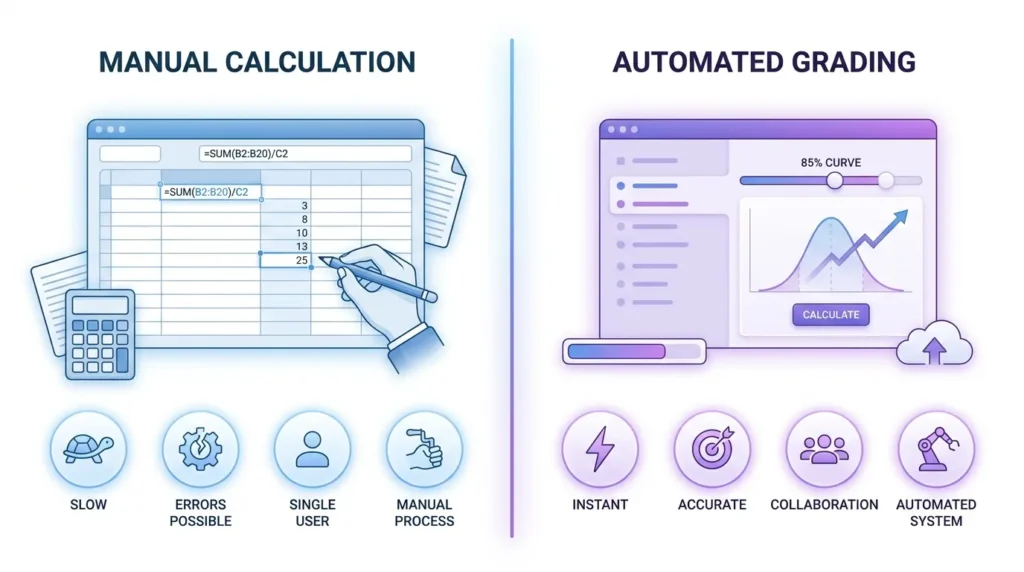
| Google Sheets | Grade Curve Calculator |
|---|---|
| Manual formulas | Automatic calculations |
| Requires spreadsheet knowledge | Beginner-friendly |
| Easy to make formula mistakes | Accurate results instantly |
| Manual charts | Built-in visualizations |
| Slower comparisons | Compare multiple grading methods quickly |
If you regularly curve grades, our Grade Curve Calculator can save time by calculating multiple grading methods without writing formulas.
Frequently Asked Questions
Yes. Once you enter the correct formulas, Google Sheets automatically updates curved grades whenever the original scores change.
Both programs use similar formulas. Google Sheets is better for collaboration, while Excel offers more advanced spreadsheet features.
A Linear Curve is the simplest because it only requires adding the same number of points to every student’s score.
Yes. Google Sheets includes functions such as AVERAGE() and STDEV.P() that make Bell Curve calculations possible.
Yes. One of the biggest advantages of Google Sheets is real-time collaboration, allowing multiple educators to work on the same spreadsheet.
Final Thoughts
Google Sheets is an excellent tool for calculating curved grades. Whether you choose a Linear Curve, Percentage Curve, Bell Curve, or Texas Root Curve, the platform provides all the formulas needed to adjust scores accurately.
However, creating and managing multiple formulas can become time-consuming, especially for larger classes. If you’d rather skip the spreadsheet setup and compare several grading methods in one place, try our Grade Curve Calculator. It lets you experiment with different grading curves, visualize score distributions, and generate adjusted grades in seconds.
By understanding how each grading method works, you can make fairer more transparent grading decisions while saving valuable time.